Q&A 23 How do you combine dimensionality reduction with clustering to improve results?
23.1 Explanation
Dimensionality reduction (like PCA or t-SNE) helps simplify high-dimensional data by projecting it into lower dimensions while retaining structure. Clustering (like k-means or DBSCAN) then becomes more effective and less noisy. This is a common preprocessing strategy to avoid the “curse of dimensionality” in unsupervised learning.
A typical workflow:
- Scale the data.
- Apply PCA or t-SNE.
- Run a clustering algorithm on the reduced data.
- Visualize and evaluate clusters.
23.2 Python Code
from sklearn.decomposition import PCA
from sklearn.cluster import KMeans
from sklearn.preprocessing import StandardScaler
import matplotlib.pyplot as plt
import seaborn as sns
import pandas as pd

# Load and preprocess
df = pd.read_csv("data/titanic.csv").dropna(subset=["Age", "Fare"])
X = df[["Age", "Fare"]]
X_scaled = StandardScaler().fit_transform(X)

# Reduce dimensions
pca = PCA(n_components=2)
X_pca = pca.fit_transform(X_scaled)

# Cluster
kmeans = KMeans(n_clusters=3, random_state=42)
labels = kmeans.fit_predict(X_pca)

# Plot
sns.scatterplot(x=X_pca[:, 0], y=X_pca[:, 1], hue=labels, palette="Set2")
plt.title("PCA + KMeans Clustering")
plt.xlabel("PC1")
plt.ylabel("PC2")
plt.show()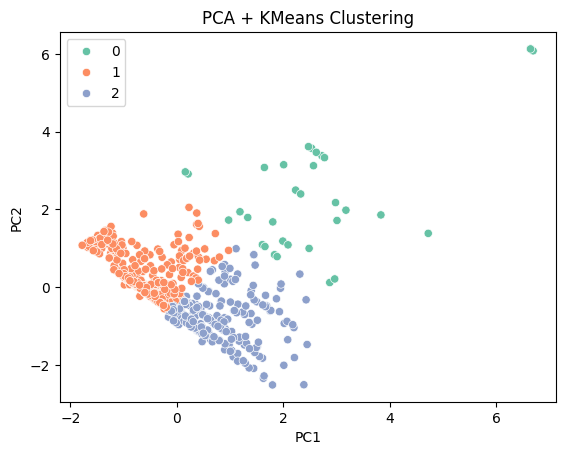
23.3 R Code
library(tidyverse)
library(cluster)
library(factoextra)

# Load and preprocess
df <- read_csv("data/titanic.csv") %>%
  filter(!is.na(Age), !is.na(Fare))

X <- df %>% select(Age, Fare) %>% scale()

# PCA
pca_res <- prcomp(X, scale. = TRUE)
X_pca <- pca_res$x[, 1:2]

# K-means clustering
set.seed(42)
km <- kmeans(X_pca, centers = 3)

# Plot
fviz_cluster(list(data = X_pca, cluster = km$cluster),
             geom = "point", ellipse.type = "norm", palette = "Set2") +
  labs(title = "PCA + KMeans Clustering")
✅ Takeaway: Dimensionality reduction simplifies data and often improves clustering performance and interpretability, especially in high-dimensional datasets.