Q&A 19 How do you perform clustering with k-means?
19.1 Explanation
K-means clustering is an unsupervised algorithm that groups data into k clusters based on feature similarity. It minimizes the distance between data points and the centroid of their assigned cluster.
Unlike classification, clustering doesn’t require labels — it’s great for pattern discovery, segmentation, and exploratory analysis.
We’ll use the Gene Expression with Clusters dataset here, which is designed for clustering practice.
19.2 Recommended Dataset: Gene Expression (Unlabeled Clustering)
- Name:
gene_expression_with_clusters.csv
- Source: Synthetic or open dataset
- Task: Group samples based on gene expression profiles
- Features: Simulated expression levels, cluster labels for reference only
Why it’s great:
- ✅ Ideal for demonstrating unsupervised techniques
- ✅ Has a known underlying structure for evaluation
- ✅ Works well with PCA, t-SNE, and visual clustering
19.3 Python Code
import pandas as pd
from sklearn.cluster import KMeans
import matplotlib.pyplot as plt
from sklearn.decomposition import PCA

# Load dataset
df = pd.read_csv("data/gene_expression_with_clusters.csv")

# Keep only numeric features for clustering
X = df.select_dtypes(include='number')  # drops Sample_ID or other text columns

# Perform k-means clustering
kmeans = KMeans(n_clusters=3, random_state=42)
clusters = kmeans.fit_predict(X)

# Visualize using PCA (2D projection)
pca = PCA(n_components=2)
X_pca = pca.fit_transform(X)

plt.scatter(X_pca[:, 0], X_pca[:, 1], c=clusters, cmap='viridis', s=50)
plt.title("K-means Clustering (PCA Projection)")
plt.xlabel("PC1")
plt.ylabel("PC2")
plt.show()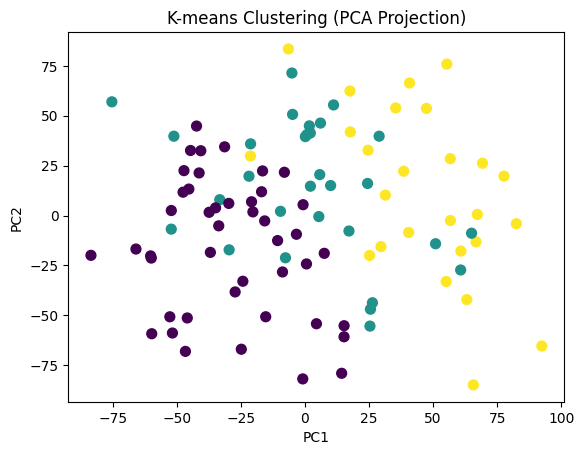
19.4 R Code
# K-means clustering in R
library(readr)
library(ggplot2)
library(dplyr)
library(cluster)
library(factoextra)

# Load dataset
df <- read_csv("data/gene_expression_with_clusters.csv")

# Remove label column if it exists
X <- df %>% select(-SampleID)

# Apply k-means
set.seed(42)
kmeans_result <- kmeans(X, centers = 3, nstart = 25)

# Visualize using PCA
fviz_cluster(kmeans_result, data = X,
             ellipse.type = "norm", geom = "point", repel = TRUE,
             ggtheme = theme_minimal())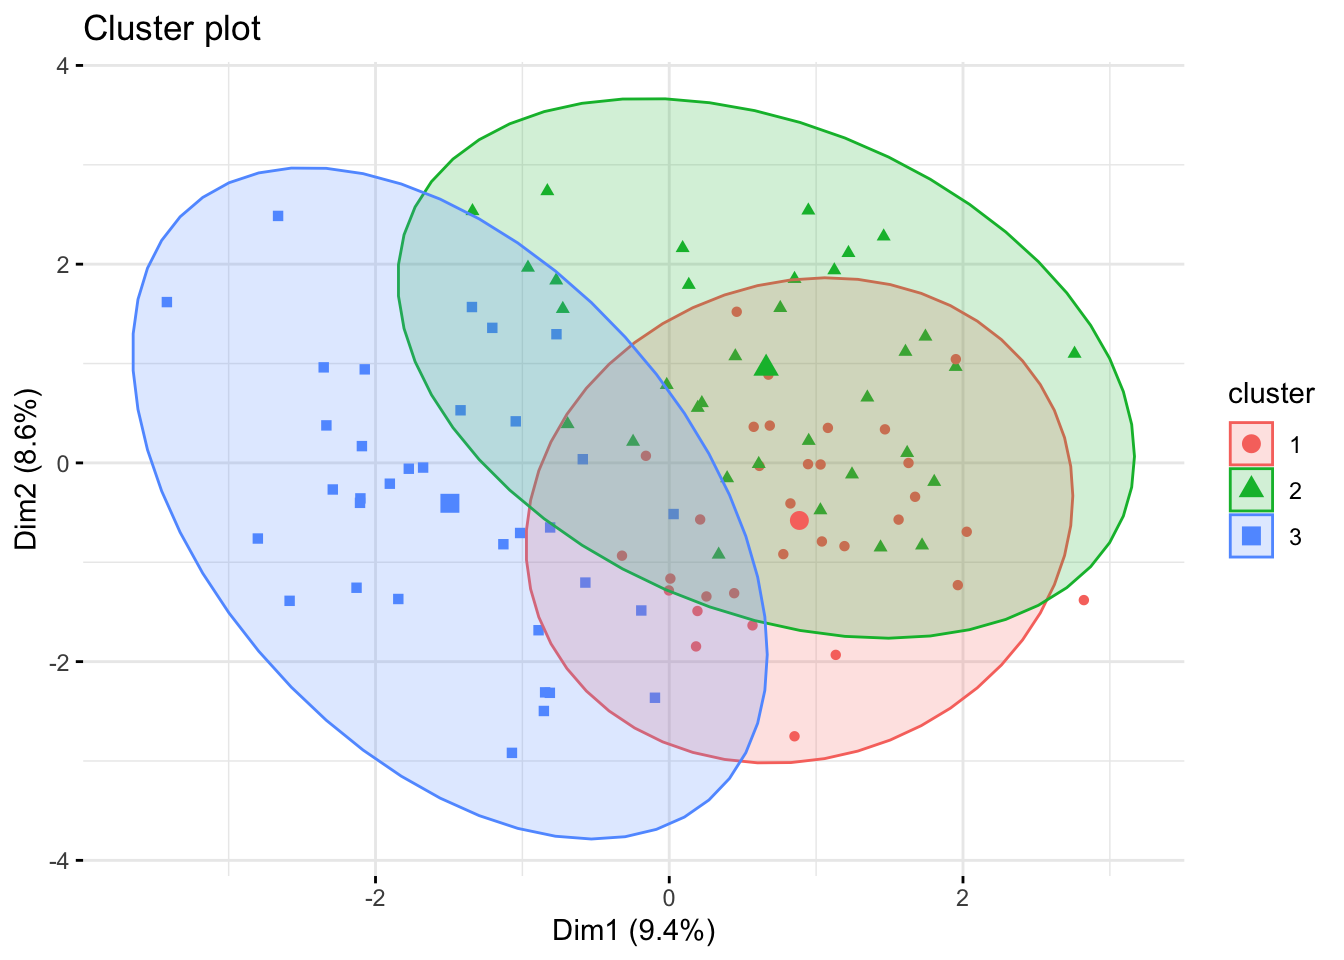
✅ Takeaway: K-means reveals hidden groupings in data. While it doesn’t use labels, it’s great for exploring structure, segmenting users, or visualizing high-dimensional datasets.