Q&A 9 How do you evaluate a model using ROC curve and AUC?
9.1 Explanation
The ROC (Receiver Operating Characteristic) curve visualizes the trade-off between the true positive rate (TPR) and the false positive rate (FPR) across different classification thresholds.
The AUC (Area Under the Curve) summarizes the model’s ability to distinguish between classes: - AUC = 0.5 → random guessing - AUC = 1.0 → perfect classification
ROC and AUC are especially useful when accuracy may be misleading due to class imbalance.
9.2 Python Code
# ROC curve and AUC in Python
import pandas as pd
from sklearn.model_selection import train_test_split
from sklearn.tree import DecisionTreeClassifier
from sklearn.metrics import roc_curve, roc_auc_score, RocCurveDisplay

# Load and preprocess
df = pd.read_csv("data/titanic.csv")
df['Age'] = df['Age'].fillna(df['Age'].median())
df['Embarked'] = df['Embarked'].fillna(df['Embarked'].mode()[0])
df['Sex'] = df['Sex'].map({'male': 0, 'female': 1})
df = pd.get_dummies(df, columns=['Embarked'], drop_first=True)

# Feature and target
X = df[['Pclass', 'Sex', 'Age', 'Fare', 'Embarked_Q', 'Embarked_S']]
y = df['Survived']

# Train-test split
X_train, X_test, y_train, y_test = train_test_split(X, y, test_size=0.2, random_state=42)

# Train decision tree
clf = DecisionTreeClassifier(random_state=42)
clf.fit(X_train, y_train)

# Predict probabilities
y_proba = clf.predict_proba(X_test)[:, 1]

# Compute ROC curve and AUC
fpr, tpr, thresholds = roc_curve(y_test, y_proba)
auc_score = roc_auc_score(y_test, y_proba)

# Plot ROC
RocCurveDisplay(fpr=fpr, tpr=tpr, roc_auc=auc_score).plot()
print("AUC Score:", auc_score)
AUC Score:
0.8054697554697555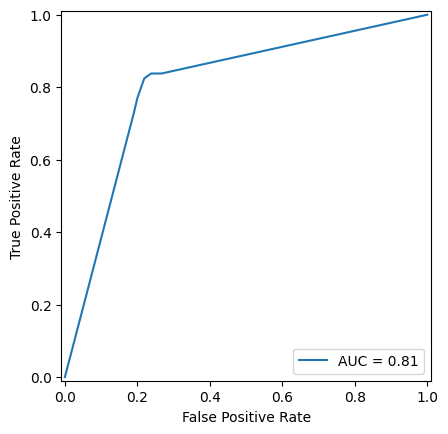
9.3 R Code
# ROC curve and AUC in R
library(readr)
library(dplyr)
library(fastDummies)
library(caret)
library(rpart)
library(pROC)

# Load and preprocess
df <- read_csv("data/titanic.csv")
df$Age[is.na(df$Age)] <- median(df$Age, na.rm = TRUE)
mode_embarked <- names(sort(table(df$Embarked), decreasing = TRUE))[1]
df$Embarked[is.na(df$Embarked)] <- mode_embarked
df$Sex <- ifelse(df$Sex == "male", 0, 1)
df <- fastDummies::dummy_cols(df, select_columns = "Embarked", remove_first_dummy = TRUE, remove_selected_columns = TRUE)

# Prepare data
features <- df %>% select(Pclass, Sex, Age, Fare, Embarked_Q, Embarked_S)
target <- df$Survived
set.seed(42)
split_index <- createDataPartition(target, p = 0.8, list = FALSE)
X_train <- features[split_index, ]
X_test <- features[-split_index, ]
y_train <- target[split_index]
y_test <- target[-split_index]
train_data <- cbind(X_train, Survived = y_train)

# Train model
tree_model <- rpart(Survived ~ ., data = train_data, method = "class")

# Predict probabilities
y_proba <- predict(tree_model, X_test)[, 2]

# Compute ROC and AUC
roc_obj <- roc(y_test, y_proba)
plot(roc_obj, main = "ROC Curve")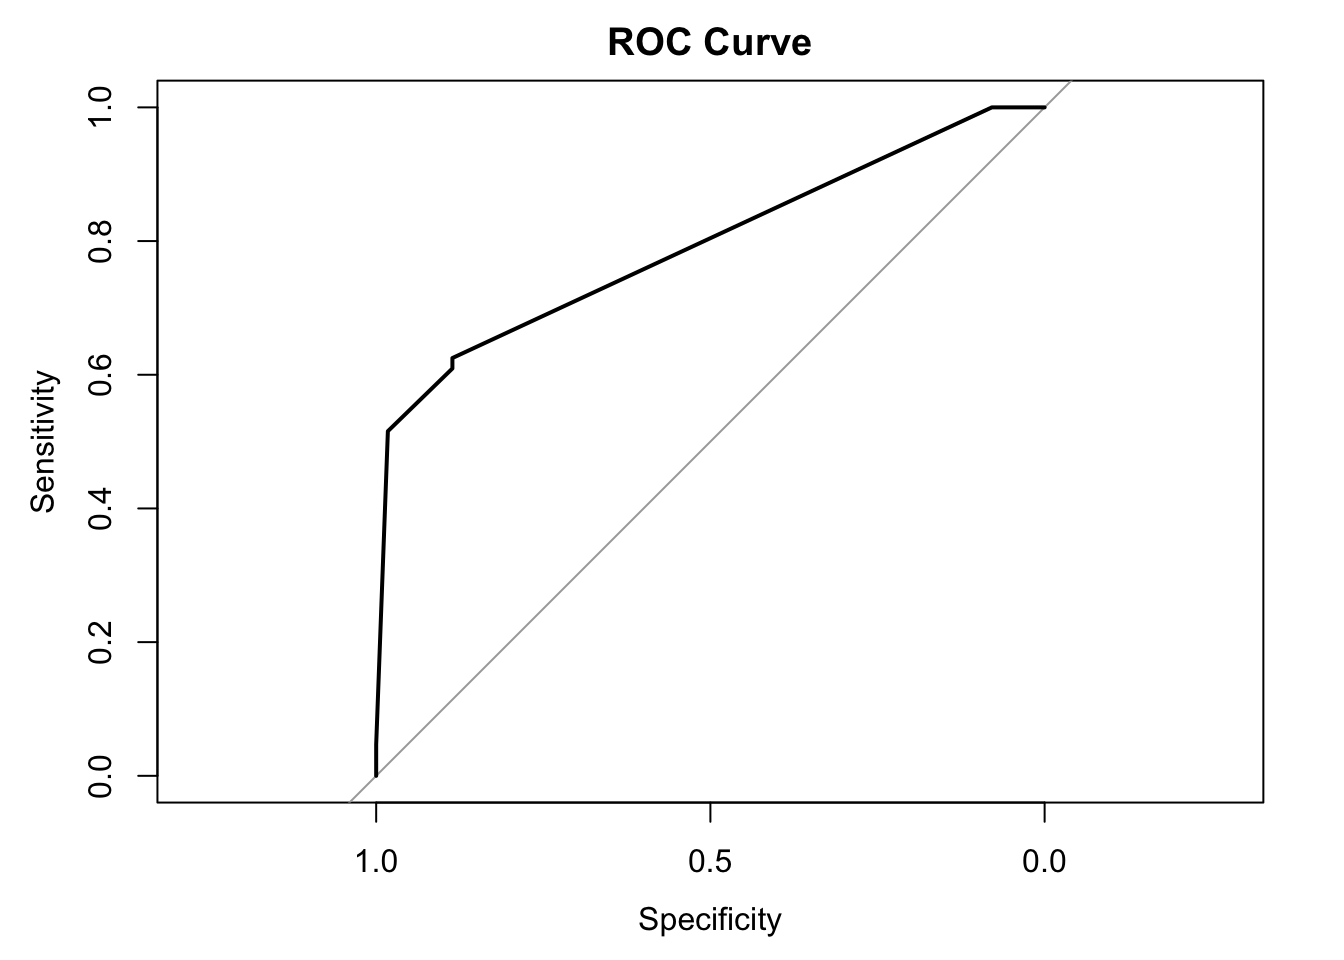
Area under the curve: 0.7939✅ Takeaway: ROC curves and AUC scores are powerful tools for evaluating model discrimination — especially when classes are imbalanced or when false positives and false negatives have different costs